

Introduction
Polyamide is a thermoplastic polymer consisting of repeating amide unit backbone (Kim & Creasy, 2004). Polyamide 12 (PA12) is a semi-crystalline polymer (Vasquez, Majewski, Haworth, & Hopkinson, 2014; Zhu, Y, Sy, & Wen, 2016) with a melting temperature more significant than the crystallisation temperature. The augmented 'sintering window' reduces the crystallisation pace of the substance, minimising residual stresses and distortions build-up (Salazar, Rico, & Rodríguez, 2014). Consequently, PA12 is frequently employed in medical instruments, particularly endovascular catheters.
PA12 possesses remarkable impact resistance and the lowest moisture absorption amongst polyamides (PAs) (Connor & Dowling, 2020). The material also has low water absorption and density (1.01 g/cm3). The attributes are due to the long hydrocarbon chain of PA12, resulting in its dimensional stability and paraffin-like composition. The melting point of PA12 is within the 178–180°C range, the lowest among essential PAs. The mechanical properties of PA12 (hardness, tensile strength, and abrasion resistance) are parallel to nylon 6 or nylon 66 (Martynková, Slíva, & Kratošová, 2021; Touris, Turcios, & Mintz, 2020).
PA12 is commonly used in medical devices, especially in endovascular catheters. PA12 also possesses exceptional resistance to impact at low temperatures, stress cracking, most standard organic solvents (Martynková et al., 2021; Touris et al., 2020), fatigue under high-frequency cyclical loading parameters, and processability. Nevertheless, PA12 is susceptible to numerous degradation reactions.
Although PA12 is known for its significant crystallinity, which is attributable to its reduced molecular weight, the material is also brittle. The substance exhibits partial degradation during injection moulding or extrusion, which could also contribute to its increased brittleness. Consequently, PA12 molecular weight is critical when designing a part or a device. Hydrated PA12, which has the lowest molecular weight, was reported to have the most brittle behaviour. Nevertheless, the PA12 elastic modulus documented 110 MPa before hydration and 53 MPa post-overnight hydration. The elastic modulus variation demonstrates the plasticisation effects of the absorbed water on PA12 mechanical attributes (Touris et al., 2020).
PA12 has been widely utilised in dentistry to fabricate flexible dentures for patients with prominent undercuts. The material has high moulding property (Katsumata, Hojo, & Hamano, 2019), thus making it suitable for restoring the canal space. The composite takes the shape of the canal without forming voids. Nonetheless, PA12 has a lower elasticity modulus than dentine, which could be overcome by adding fillers. Fabricating a novel post from non-metal materials with flexure strength almost similar to dentine might offer a way to save root canal-treated teeth.
Wang, Chang, and Lin (2016) reported the utilisation of PA12 posts reinforced with short glass fibres. The study noted that the polymer recorded good clinical outcomes compared to commercial FRC posts. Nevertheless, synthetic fibres are harmful and expensive (Asyraf, Ishak, & Syamsir, 2022). Consequently, employing fillers from natural sources might be an alternative and simultaneously aid in preserving the environment. The present study aimed to produce and characterise dental posts from PA12 nanocomposite incorporated with nano-cellulose and -silica.
Methodology
Preparing the oil palm fibre
The raw oil palm fibre from the empty fruit bunch (OPEFB) employed in this study was washed with filtered tap water to remove any surface residue or impurities. The fibres were oven-dried at 50°C for 24 h. Subsequently, the OPEFBs were cut to 0.5–1 cm before further treatments (Fahma, Iwamoto, & Hori, 2010).
Cellulose extraction
Dewaxing performed in this study was conducted based on the protocol reported by Lamaming, Hashim, and Sulaiman (2015). A total of 10 g of oil palm fibres were weighed and placed in a cotton thimble. The dewaxing procedure was performed in a Soxhlet reflux with a 2:1 v/v ethanol-to-toluene ratio for 5 h before being filtered with a Buchner funnel, washed with distilled water, and oven-dried at 50°C overnight.
During the alkali treatment, 5 g of extractive-free fibres were treated with 200 mL 5% sodium hydroxide (NaOH) solution at 80°C for 2 h with a hot plate and mechanical stirring. Subsequently, the samples were filtered and washed. The samples were assessed until they reached neutral pH before being oven-dried at 50°C overnight.
A three-mouthed condenser flask submerged in paraffin oil was used in the bleaching procedure performed in the present study. Distilled water (125 mL), acetic acid (1 mL), and 25% sodium chlorite (NaClO) solution (3 mL) were added to the flask. Subsequently, 1 g of the alkali-treated fibre samples were incorporated into the mixture under mechanical stirring for 2 h at 70°C with a hot plate. The specimens were filtered and washed to obtain neutral pH fibres before being oven-dried at 50°C overnight.
The fibre samples employed in the present study were subjected to acid hydrolysis to procure crystalline nanocelluloses (CNCs). One gram of cellulose fibres was added in an ice bath before incorporating 100 mL of 50% sulphuric acid (H2SO4) solution dropwise. The hydrolysis treatment was then conducted at room temperature with mechanical stirring for 60 min. Subsequently, 200 mL of cold water was added, and the samples were placed in an ice bath. The residue containing CNC was diluted four times and centrifuged with distilled water at 7900 rpm for 10 min. A dialysis tubing cellulose membrane (Thermo scientific, USA) was employed to perform dialysis until samples with pH 7 were obtained before oven-drying them at 50°C overnight.
The silanisation solution employed in this study consisted of 100 mL of 75% ethanol (Etoh), 5 mL of (3-Aminopropyl) triethoxysilane (APTES), and acetic acid glacial to obtain pH between three and four. Subsequently, 1 g of CNC was added to the solution under mechanical stirring for 2 h. The solution was centrifuged with 75% Etoh thrice at 7900 rpm for 10 min before oven-drying it for 10 minutes (Taib, Hamidon, Garba, & N, 2022).
Silica
The silane-treated rice husk (RH) nano-silica employed in this study was purchased from Usains Tech Services Sdn Bhd. The substance was produced by the School of Dental, Universiti Sains Malaysia (USM). The nano-silica was utilised as received.
Preparing the samples for flexural evaluations
Wax pattern preparations
The flexural assessment conducted in this study involved 36 wax patterns prepared with stainless-steel moulds of 1.5 mm × 2 mm × 2.5 mm.
Wax pattern flasking
Plaster of Paris (P.O.P) and green stone powder were mixed with water with ratio (1:1:1) and poured into the aluminium denture flask. 6 wax patterns were arranged in tree-like shapes. A sprue was added using utility wax. The flask was then closed, and the top part of the flask was filled with P.O.P and green stone powder mixture until the material set. Later, the flask was soaked in hot water for wax removal.
Preparing the PA12 nanocomposite dental post
The dental post nanocomposite samples in the present study were prepared based on the report by (Abdullah, Mohamad, & Rahim, 2019) with slight modifications. In this study, the mould was made from dental green stone. The PA12 powder was oven-dried at 80°C for 12 hours before sample preparation.
Group 1
The current study utilised a digital weight balance (AND, Japan) to weigh 10 g of the PA12 samples before placing the polymer in aluminium cartridges. The specimens were heated at 200°C in a microinjection machine (Sabilex biostrong 400 plus, USA) for 15 min. The molten composite compound was injected into the moulding flasks that were heated at 250°C in the oven for 30 min before the injection. The samples were obtained after cooling the flask (see Figure 1 ).

Groups 2 to 6
The PA12 samples in Groups 2 to 6 of this study were incorporated with fillers as indicated in Table 1. The fillers were weighted with a digital weight balance (AND, Japan) and mixed with the PA12 polymer in aluminium cartridges. Subsequently, the mixtures were heated at 200°C in a microinjection machine. The preparation procedures were similar to that of Group 1 samples.
Table 1
Sample grouping and compositions for flexure assessments,
Flexural strength assessment
A digital calliper (Mitutoyo, Japan) was utilised in this study to measure the thickness and height of the specimens. The flexural evaluation was performed according to ASTM D790 with an Instron Universal Testing Machine (Shimadzu, Japan) at 1 mm/min crosshead speed and 5 kN loading force.
Scanning electron microscopy (SEM analysis
In this study, the fractured samples from flexural strength selected randomly from Groups 1, 2, 3, and 6 were observed with a scanning electron microscope (SEM) (FEI Quanta FEG 450, USA). The specimens were fixed on metal stubs and sputtered with gold at 120 s cycle under vacuum. Subsequently, fracture features, fibre quantity, integrity, and homogeneity along the surfaces between the fillers and polymer matrix were determined.
Fourier transform infrared (FTIR spectroscopy
The interactions between the CNC/RH silica/CNC+RH silica and polymer matrixes of the samples in Groups 2 - 6 were evaluated with FTIR spectroscopy (Perkin-Elmer, USA). The FTIR data for the CNC, silica, and group 1 (100% PA12) specimens was collected as references. The spectra were analysed within the 4000 to 600 cm−1 transmittance mode range at 8 cm−1 resolution (Kargarzadeh, Ahmad, & Abdullah, 2012).
Results
Flexural strength assessment
The flexure analysis data were tabulated, and normality evaluations were conducted. Given that the p-value for the normality test was 0.00, the Kruskal-Wallis test was employed for data analysis. Pairwise comparisons using the Bonferroni method were performed to analyse the data between groups. The results revealed statistically significant differences in flexural strengths between the sample groups evaluated [χ2 (df) = 38.65 (6), p < 0.05] (see Table 2 ). Groups 2 (1 wt% CNC) and 3 (2 wt% CNC) samples had superior median flexural strengths than Group 1 (100 wt% PA12). Nonetheless, the flexural strength value reduced in groups 4 (20 wt% RH silica), 5 (19 wt% SLC+1wt% CNC), and 6 (18 wt% RH silica + 2 wt% CNC).
Group 7 (everStick post) samples recorded the highest median flexural strength, while the specimens from Group 5 (19 wt% SLC + 1 wt% CNC) had the lowest value, 227.72 and 31.98 MPa, respectively. Group 3 documented the highest median value among the experimental Groups (2–6). Nevertheless, pairwise comparison for samples with CNC fillers, TGroups 2 and 3, did not demonstrate a significant difference in p-value (0.090 and 0.397) compared to Group 7 (everStick) (see Table 3 ).
Table 2
The flexure strength comparison.
Table 3
Pairwise comparison to compare between groups.
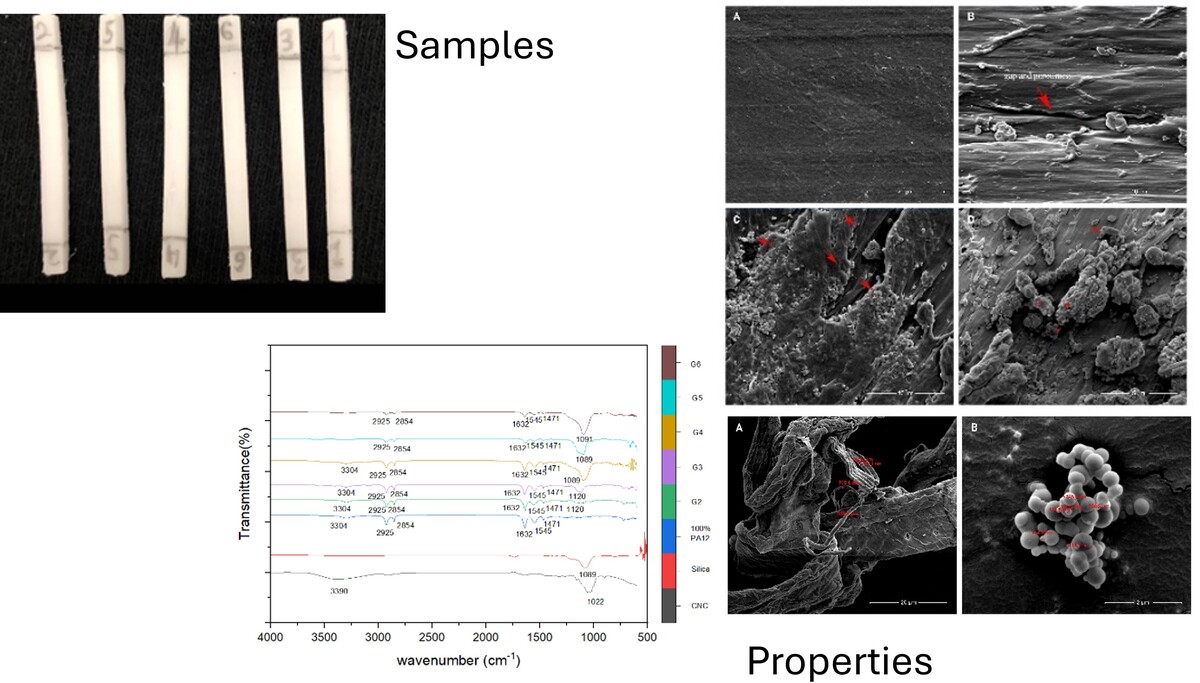
The SEM of the fractured surfaces
Figure 2 illustrates the CNC (5000× magnifications). The fibre bundles were tubular with diameters of approximately 706–138 nm. Figure 3 demonstrates the RH silica image (50 000× magnification), which was spherical and has a grape-like cluster appearance, measuring around 114–345 nm. The 100% PA12 sample is illustrated in Figure 4 (5000× magnification).

Figure 3
The SEM image at 50 000x magnification reveals RH silica fillers in the form of spherical particles arranged in grape-like cluster.
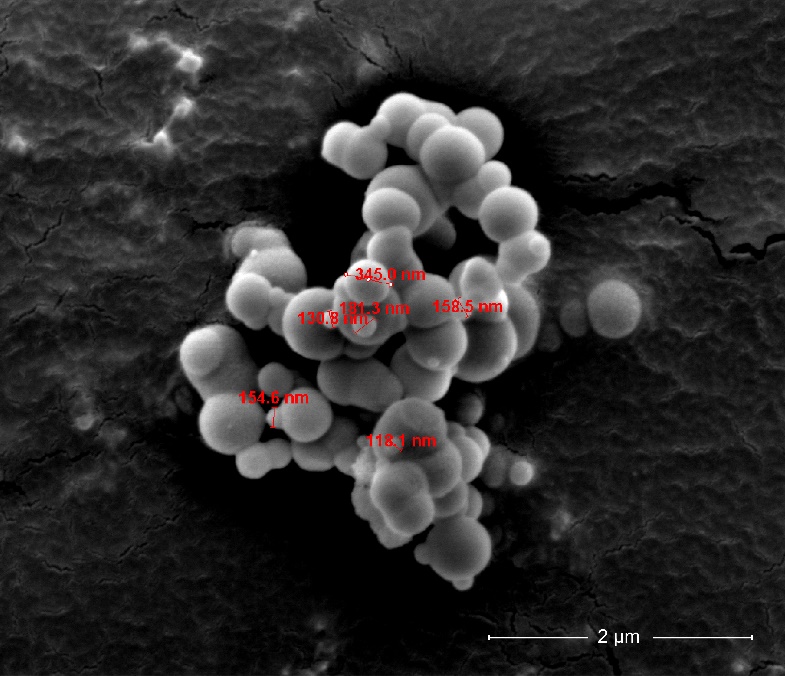

Figure 5 illustrates the PA12 composite with CNC fillers observed under 10 000× magnification. Although the CNC was dispersed well in the PA12 matrix, some were clumped to each other. Multiple gaps were also noted between the CNC and the polymer matrix. Similarly, in the PA12 composite with RH silica fillers, the fillers were dispersed well, with some agglomeration to each other (see Figure 6 ). Multiple gaps were also observed between the silica and the PA12 matrix. Figure 7 demonstrates the sample with both fillers under 10 000× magnification. The SEM images confirmed the presence of the fillers in the PA12 samples, where the RH silica surrounded the outer surface of the CNC, and they were embedded in the matrix.


The FTIR data analysis
The FTIR data obtained in the present study is demonstrated in Figure 8 . Generally, all PA12 composites (Groups 2–6) exhibited almost identical results. The peaks between 1466 and 3294 cm−1 and 561 and 721 cm−1 also recorded similar bonds to the unfilled PA12 sample.

Discussion
Flexural strength comparison
Incorporating CNC into the PA12 matrix in Groups 2 and 3 increased the flexural strength of the composite to 175.95 and 177.92 MPa, respectively. Nevertheless, no remarkable variation was observed between the samples and their unfilled PA12 counterpart. Increased CNC filler percentages in Group 2 (1% CNC + 99% PA12) and Group 3 (2% CNC + 98% PA12) specimens improved flexural strength, 78.16 and 1.97 MPa, respectively.
Although no significant differences were documented, the enhanced flexure strength of the PA12 composites reinforced with CNC compared to unfilled PA12 was attributable to CNC. This bio-based substance is an excellent polymer-reinforcing material. CNC could also effectively absorb stress from the matrix (Bangar, Harussani, & Ilyas, 2022; Spinella, Re, & Liu, 2015; Xu, Liu, & Jiang, 2013). Furthermore, the hydrophilic character of CNCs is responsible for absorbing water, thus enhancing the flexural characteristics of the PA12 matrix. For instance, a report revealed that adding up to 0.2 vol% of CNC increased hydration, improving flexural strength by 30% (Cao, Zavaterri, & Youngblood, 2015).
The non-polar hydrophobic bond between the PA12 matrix and the CNC fibres augmented the dispersity of the hydrophilic polar fibres. The condition aided matrix to OPF stress transfers (Asyraf et al., 2022). Although the flexural strengths of Groups 2 and 3 (175.95 and 177.92 MPa) samples were higher than the unfilled PA12 (Group 1), the strengths of the samples were still lower compared to the everStick post (Group 7).
The findings in the present study were slightly different compared to Wang et al. (2016). The report indicated that adding fibre fillers increased the flexural strength of PA12 significantly than commercial posts. Nonetheless, the post employed by Wang et al. (2016) was X-Post Radix Fibre Post (Denstply, Switzerland), which differed from the composite utilised in the current study (everStick). Furthermore, the short-glass fibres employed in the literature possessed properties that were different from natural fibre. Glass fibres are twice as dense as natural fibre.
Abdullah et al. (2019) suggested that 20% filler is optimal for enhancing the mechanical attributes of PA12 composites. Nevertheless, the flexural strength of Group 4 samples in this study was reduced to 41.92 MPa, which was over 50% significantly lower than those without fillers, the commercial post, and both groups with CNC fillers (Groups 2 and 3). The observation might be due to the amorphous characteristics of RH silica, which is considerably brittle and loose (Liou, 2004; Noushad, Rahman, I, Mohamad, & D, 2016).
An amorphous structure is not strong as it is held only by weak covalent bonds. Furthermore, the positions of atoms in amorphous substances are unpredictable through any equations compared to ordered crystalline atomic motifs, which have perfect crystal structures commonly represented by spherical packing (Stachurski, 2011). Sheng, Alawi, and Johari (2023) reported that rice husk silica nanohybrid dental composites demonstrated inferior flexural and compressive strengths and Vicker’s hardness than their commercial counterparts.
The role of each filler in altering the mechanical attributes of the specimens from Groups 5 and 6, which contained a combination of both fillers, was evaluated in this study. The flexural strength of Group 5 specimens decreased to 31.98 MPa when 1 wt% CNC and 19 wt% RH silica were incorporated into the PA12 matrix. The observation revealed that combining the fillers resulted in a weaker composite.
A slight improvement in the mechanical characteristics of PA12 was noted when the percentage of CNC was increased to 2%, and the RH silica was reduced to 18%. The composites in Group 6 documented a 48.41 Mpa flexural strength. Abdullah et al. (2019) reported a similar trend. The study incorporated a ZrO2/β-TCP hybrid into PA12 and recorded a slightly increased flexural strength by 3.1 MPa. The report demonstrated that flexural strength improved linearly with rising filler content up to 35% but diminished at higher filler contents. Consequently, the appropriate ratio and filler percentage are critical in enhancing the flexural strength of PA12 composites. The phenomenon is attributable to the ability of the molecular chains to be parallelly aligned with the forces applied.
In this study, adding RH silica into the PA12 matrix reduced the flexural strength of the composite while incorporating CNC enhanced the feature. In Group 6, the RH silica percentage was lowered to 18%, while the CNC added was raised to 2%. The flexural strength of Group 6 samples also increased to 48.41 MPa compared to Group 5 (31.98 MPa), which had a higher RH silica percentage. The results revealed that increasing the percentage of CNC also improved flexural strength. Conversely, RH silica was not beneficial as it diminished the flexural strength of the PA12 matrix.
The FTIR analysis
Peaks within 1471 to 3304 cm−1 and 561 to 722 cm−1 ranges exhibited identical bonding to 100% PA12 (Abdullah et al., 2019). The specimens evaluated in this study also demonstrated similar peaks to 100% PA12, indicating the presence of PA12 in the composite. Nonetheless, introducing 1 to 2% of CNC fillers intensified the 1120 cm−1 peak. The peak could represent hydrogen bonds formed between -NH- in PA12 and CNC. Abdullah et al. (2019) also reported similar results when β-TCP was added to PA12. Nevertheless, the peak was absent in group 4 specimens, indicating no hydrogen bonds were present as no CNC was incorporated into the composite.
The peaks at 3000 to 3600 cm−1 represent the OH− vibration groups (Lee, Pai, & Chang, 2013) and were observed in Groups 1, 2, 3, and 4 samples and CNC. The peak at 3304 cm−1 might denote the hydrogen bonds formed between the CNC (Groups 2 and 3) and RH silica (Group 4) and the PA12 matrix (see Figure 8). Nonetheless, the peak vanished when both fillers were introduced simultaneously into the matrix (Groups 5 and 6), indicating that they could be bonding with each other instead.
In this study, the CH2 asymmetric stretching mode was attributed to the 2925 and 2854 cm−1 peaks, which were observed in all samples. Nonetheless, the peak intensity decreased in samples with CNC and RH silica fillers, Groups 5 and 6. The peaks within the 1089–1091 cm−1 range of samples from Groups 4, 5, and 6 intensified due to the presence of RH silica, distinguishing the specimens from the composites in Groups 1, 2, and 3, which were without the filler (Abdullah et al., 2019).
The peaks at 806–876, 1112–1113, and 1636 cm−1 represented the RH silica in Groups 4, 5, and 6. On the other hand, peaks observed at 1632, 1545, and 1471 cm−1 denoted C=O, C-N, and CH2 bending, respectively. The CH2 rocking mode was attributed to the 721–723 cm−1 peaks, while the 611 and 561 cm−1 peaks shared similar N-H out-of-plane bending modes. The minuscule peak documented at 782 cm−1 indicated the Si-CH bending, while the small peak at 782 cm−1 was close to the theoretical value (793 cm−1) for Si-CH bending reported by R Rangel-Vázquez, Aurea, and Leal-García (2010).
The FESEM evaluation
Only individual CNC and silica and Groups 2, 3, and 6 samples FESEM micrographs were chosen for further surface study. The specimens were selected to represent each composite group containing different fillers. Essentially, irregularly shaped CNCs were observed on the cross-sectional area of the fractured samples. Most of the CNC specimens were also in bundles and clumped to each other.
Numerous reports have documented the agglomeration of OPF in polymer matrices (Ferrer, Filpponen, & Rodríguez, 2012; Jonoobi, Oladi, & Davoudpour, 2015; Lim, Cheng, Tan, & Yu, 2022; Norrrahim, Ariffin, & Yasim-Anuar, 2021; Shinoj, Visvanathan, Panigrahi, & Kochubabu, 2011). The agglomeration documented in the present study was due to the OPF properties of the natural fibre, which possesses hydroxyl groups. Consequently, hydrogen bonds were formed, resulting in poor fibre dispersion and matrix-fibre interactions (Bangar et al., 2022; Jonoobi et al., 2015).
Many reports have been made on the agglomeration of OPF in the polymer matrix (Ferrer et al., 2012; Jonoobi et al., 2015; Lim et al., 2022; Norrrahim et al., 2021; Shinoj et al., 2011). Due to the agglomeration, CNC particles did not bind well within the matrix. Bundles of CNC were seen across the surface of the matrix but not all of them were bonded or embedded within the matrix. The RH silica assessed in the present study had a grape-like structure and was in spherical clusters of varying sizes. According to Noushad et al. (2016), the spherical shape of RH silica allowed increased filler loading and enhanced the fracture strength of the resultant composites. Moreover, Masouras, Silikas, and Watts (2008) reported that combining relatively small and different-sized (hybrid) fillers permitted a denser packing, improving the filler volume fraction of the resin composites.
The surface topology of the PA12 evaluated in this study was irregular and rough with nanocellulose addition. The data were similar to the survey by Mo, Guo, and Liu (2015), where the surface of the composite, CNC-reinforced PLGA nanofibre, became rougher with rising CNC amounts. Burhani, Septevani, and Setiawan (2021) also discovered varied pore sizes and shapes when 2 wt% of CNC were incorporated. Similar observations were documented in the current study.
Despite the agglomeration, the CNC and RH silica fillers were well dispersed throughout the matrix. The phenomenon might be due to the fillers being treated with silane. C Condon and Ferracane (1997) reported that significant silane-treated filler concentrations would lead to better filler-matrix bonds and reduced agglomeration degree.
Conclusion
Increasing the CNC percentage improved the flexural strength of PA12 polymer. Furthermore, PA12 reinforced with CNC from OPF exhibited potential as a dental post. Conversely, incorporating RH silica decreased the flexural strength of the PA12 composite. Nevertheless, further studies are necessary to assess the performance of the post on actual teeth.
Recommendations for future research
This study employed only 1% and 2% CNC and 20% RH silica fillers. Consequently, future studies should investigate different CNC percentages as the mechanical properties of PA12 composites could be enhanced by increasing the filler contents. Varying the CNC-to-silica ratio and mixing technique are also critical issues to be considered in future investigations. Subsequent research should also evaluate the utilisation of mechanical stirring (twin screw extruder), which could produce small composite samples.
Data Availability
The data set used in the current study will be made available at reasonable request.
Funding
This research project was fully funded under the Ministry of Higher Education Malaysia for Fundamental Research Grant Scheme (FRGS/1/2020/STG05/USM/02/13).
Ethical approval
This study was approved by The Human Research Ethics Committee of Universiti Sains Malaysia (JEPeM no: USM/JEPeM/KK/23040341).